How Ard’s Solar Forecasting Model Outshone the Competition Across Every Scenario
Dan Silverman
Introduction
In the fast-moving transition to clean energy, solar power has become a foundational technology for utilities and developers worldwide. But with solar’s rise comes a challenge: variability. Output can shift dramatically with changes in cloud cover, sun angle, and environmental conditions.[1] In this evolving landscape, accurate solar power forecasting isn’t just helpful – it’s essential. It informs grid stability, market participation, operational planning, and the financial success of solar projects.[2]
That’s why Ard undertook a comprehensive internal benchmarking analysis of its proprietary solar power forecasting model against a leading third-party alternative. The result? Ard’s model consistently delivered lower error rates and better predictive performance across a range of tested conditions.
In this article, we unpack those results, explain what was tested, and explore what the findings mean for the solar energy industry.
Why Forecast Accuracy Is Business-Critical for Solar Energy
Accurate forecasts drive critical decisions. Whether it’s how much energy to bid into the market, when to perform maintenance, or how to balance supply and demand across a network, solar forecast quality directly impacts costs and revenue.[1] Poor forecasts lead to:
- Grid imbalances and penalties
- Missed market opportunities
- Inefficient storage and dispatching
- Lower investor confidence
As more markets demand higher precision in renewable forecasts, outperforming in solar forecasting accuracy becomes a source of competitive advantage.[2]
How Ard’s Solar Forecasting Model Works
Ard’s forecasting method is grounded in physical modelling, enhanced by localised calibration. It follows a structured three-stage process:
- Clear-Sky Irradiance Modelling: Calculates the theoretical solar irradiance under cloudless conditions.
- Cloud Cover Adjustment: Modifies this baseline using forecasted cloud cover, which has the greatest impact on output variability.[1]
- AC Power Conversion: Converts the adjusted irradiance to site-specific AC output using input parameters such as tilt, azimuth, and system efficiency.
This layered approach enables the model to capture both universal solar behaviour and site-level nuances.
Solar Forecasting Scenarios Tested
Understanding solar forecasting performance means testing models in a variety of realistic conditions. Ard’s internal benchmarking considered two categories of real-world conditions that reflect the diverse challenges solar operators face:
Overall Solar Forecast Accuracy
These scenarios measure how accurately the model predicts solar power output across typical operating conditions:
- All Data: How well the model performs across full daily operating hours (5:00 to 19:00) at all sites. This is the broadest test of day-to-day reliability under real-world operating conditions.
- Clear Sky Data: How accurate the model is on days with minimal cloud cover, eliminating errors from inaccurate cloud forecasts. This removes uncertainty from cloud forecast errors and isolates the accuracy of the underlying model logic.
- Peak Hours Clear Sky: Focuses on how the model performs during midday production (10:00 to 14:00) under clear sky conditions. This period of time is when solar power output – and therefore revenue potential – is at its highest. Accuracy during this window is especially important for traders and operators.
These tests are about evaluating the model’s general ability to predict how much power will be produced, under normal and ideal conditions.
Observation Drop Detection
These scenarios specifically target moments when actual power output dropped significantly – and test whether the model predicted those drops correctly:
- All Observation Drops: Looks at all sudden drops in power (most likely driven by cloud movements), regardless of weather conditions or time. These events are difficult to predict but highly disruptive to operations and grid balancing.
- Clear Sky Observation Drops: Filters out cloud effects to see if the model detects drops unrelated to weather. This helps validate the model’s ability to detect or explain observation drops caused by system faults or shading, independent of weather.
- Peak Hours Observation Drops: Focuses on unexpected dips in output during peak solar hours. These are among the most commercially and operationally critical to catch accurately.
- Peak Hours Clear Sky Observation Drops: The most ideal conditions – no clouds, no tilt angle challenges, just testing the model’s raw ability to detect unexpected drops in power output during the most commercially sensitive period of the day.
By focussing on observation drops, we are testing whether the model correctly predicted sudden changes in output. We’re looking at how often the model was right, how often it gave a false alarm, and how often it missed a real drop. This helps us understand how well the model handles difficult or surprising situations.
By testing across these varied scenarios, Ard can prove not only general model accuracy, but also performance during high-stakes or high-variability moments – precisely when forecasts matter most.[4]
Performance Metrics Used in Solar Forecasting
To compare the models fairly, four widely used forecasting accuracy metrics were applied: [3]
- MAE (Mean Absolute Error): This measures the average size of the forecast errors. Lower MAE means the model is generally closer to the true values.
- MAPE (Mean Absolute Percentage Error): Expresses errors as a percentage of the actual output, helping compare performance across sites with different output levels.
- RMSE (Root Mean Square Error): Like MAE, but penalises larger errors more. This is useful for understanding how often a model might get it very wrong.
- R² (Coefficient of Determination): Measures how well predicted values match actual outcomes. A higher R² means the model explains more of the variation in the real-world data.
These metrics help quantify how reliable and useful a forecast will be for making real-time and long-term decisions.[1]
What the Results Show

All Data
Across full daily hours and all stations, Ard’s model produced:
- Lower MAE, MAPE, and RMSE than the benchmark.
- Higher R², indicating stronger model fit to actual output.
This shows Ard’s baseline forecast is more accurate and reliable under general operating conditions.

Clear Sky Data
With cloud variability removed, Ard continued to outperform the third-party model. Lower MAPE and RMSE values demonstrate the strength of Ard’s.

Peak Hours Clear Sky
During the most commercially significant period (10:00 to 14:00), Ard’s forecast accuracy was especially strong. This confirms its value during high-output, high-revenue hours.
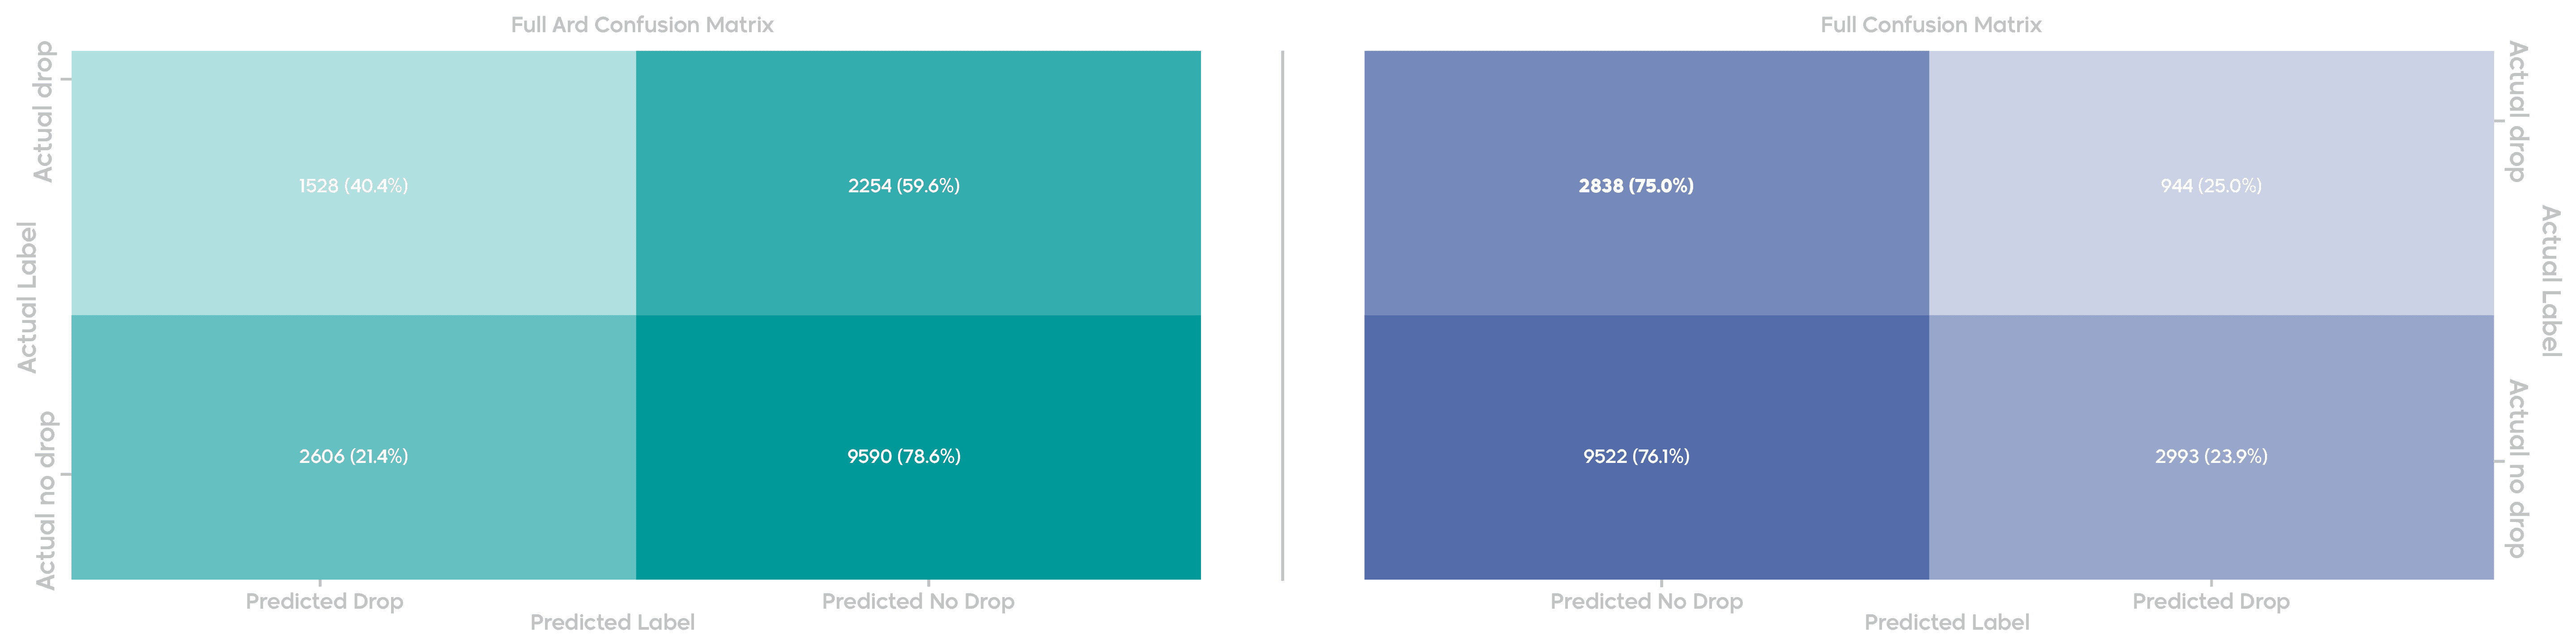
All Observation Drops
Forecasting sharp output declines is particularly challenging. Ard’s model showed:
- Higher rates of “true positives” (observation drops which were detected by the model)
- Lower rates of “false negatives” (observation drops which were missed by the model)
This suggests Ard is more reliable in identifying and forecasting rapid changes in solar power output.[4]
Clear Sky Observation Drops
Even without cloud-related errors, Ard retained a performance edge. This reinforces the model’s underlying robustness in detecting output anomalies.
Peak Hours Observation Drops
These scenarios represent the most operationally critical events: unexpected drops during high generation periods. Ard maintained lower errors and better detection, supporting its use for real-time risk mitigation.
Ard’s model picked up more real observation drops during these critical periods but also flagged more false ones. This means it was more cautious – erring on the side of over-alerting rather than missing a true drop. In high-stakes peak hours, this can be a worthwhile trade-off.
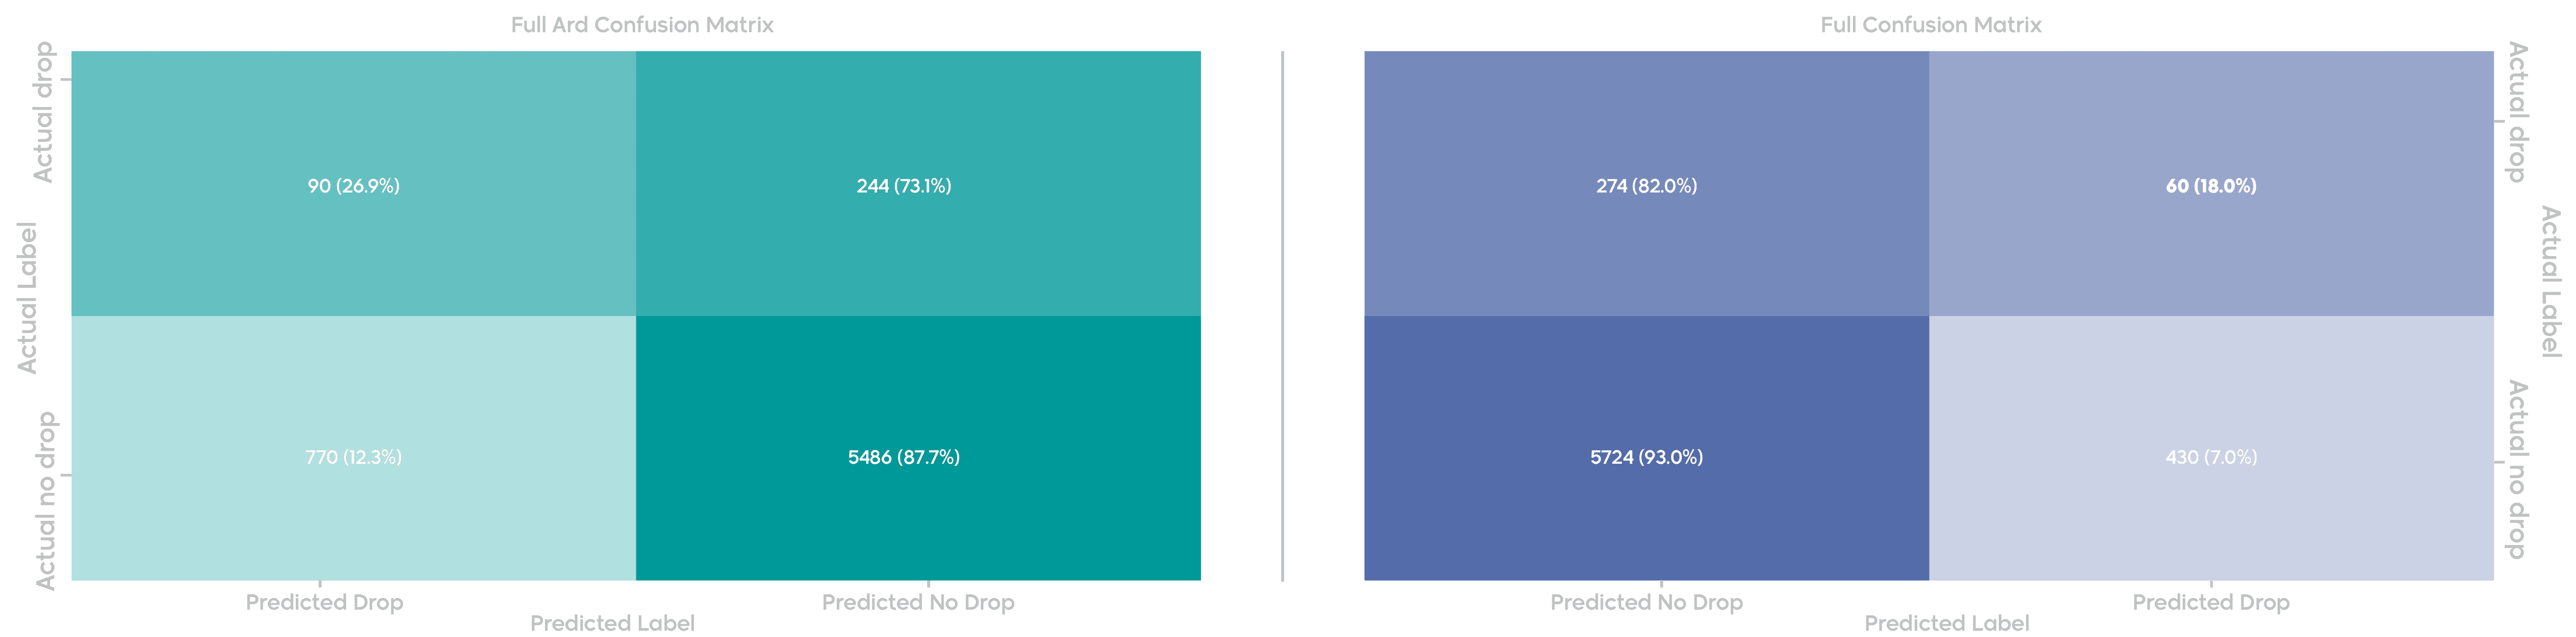
Peak Hours Clear Sky Observation Drops
This scenario filters out both cloud forecasting errors and tilt-hour effects, focusing on performance during ideal production periods. Ard maintained superior accuracy here, demonstrating its strength under optimal yet operationally important conditions.
By removing the cloud forecasting uncertainty, it becomes clearly that Ard’s model outshines the competition. It more accurately predicted when observation drops would and would not occur.
Key Findings and Implications for the Solar Industry
Key Findings
- Ard’s model outperformed the third-party provider across all seven tested scenarios.
- In clear sky cases, performance remained superior, proving the algorithm’s core strength.
- In drop detection, Ard’s model identified more true events while reducing major forecasting errors.
- The model maintained consistency across conditions, sites, and timeframes.
Implications for Solar Stakeholders
- Developers gain greater confidence in bankable forecasts
- Traders benefit from sharper midday predictions
- Operators can better anticipate and manage output volatility
- Grid managers receive more stable generation profiles, aiding dispatch planning [2]
Improved forecast reliability across all scenarios means lower risk, better financial outcomes, and more efficient grid integration.
What’s Next for Ard’s Solar Forecasting Model
While these results validate Ard’s approach, the team is focused on continual improvement in the following key areas:
AI-Based Nowcasting
Most remaining forecast errors stem from incorrect cloud cover inputs.[1] To address this, Ard is investing in advanced, AI-powered nowcasting techniques to improve short-term sky condition forecasting. These enhancements are expected to sharpen near-term predictions and support more responsive energy planning.
In addition to cloud cover, airborne dust can have a major impact on solar output – particularly in regions such as the Middle East and North Africa (MENA). Ard is currently developing an AI-based Dust Nowcasting Model that will be integrated into its solar forecasting platform. This model is designed to better capture the impact of dust on system performance, helping improve forecast reliability and energy planning in dust-prone regions.
Tilt Hour Calibration
Furthermore, additional accuracy gains are expected by refining axis tilt and azimuth parameters to better model performance during early and late sun angles.
These initiatives build on Ard’s strong forecasting foundation, offering additional layers of environmental insight where they matter most.
Conclusion
Ard’s solar forecasting model has demonstrated consistent, measurable advantages over a leading third-party provider across a broad set of operational conditions. From general output to rare drop events, and from early morning to peak hours, the model has shown that it can deliver dependable forecasts at scale.
Improvements in solar forecasting translate into better financial decisions, reduced penalties, and more resilient solar operations.[2] [4]
Ready to Upgrade Your Solar Forecasting?
Whether you’re a developer, trader, or operator, Ard’s solar forecasting model can bring improved precision and confidence to your solar portfolio.
Want to learn how we can help you increase accuracy and maximise energy value? Get in touch with our team to see how Ard’s solar forecasting platform can support your operational, financial, and market goals.
Explore Ard Forecasting with Qarar
Ard’s forecasting capabilities are available through Qarar, a decision intelligence platform that supports data-driven planning, operations, and trading in renewable energy.
Qarar combines advanced production and demand forecasting to help stakeholders stay ahead of both generation variability and shifting consumption trends.
From site-specific solar generation forecasts to AI-driven demand modelling, Qarar provides the intelligence needed to make smarter, faster energy decisions – especially during volatile or high-demand periods.
Let’s turn better forecasts into better outcomes – together.
References
- ACP - Evaluating solar radiation forecast uncertainty – Minttu Tuononen, et al. 2019
- Technology trends in forecasting renewable energy generation - REGlobal - Tech Talk – 2nd May 2022
- Metrics for Evaluating the Accuracy of Solar Power Forecasting: Preprint – J. Zhang et al. 2013
- Short term forecasting of solar radiation and power output of 89.6kWp solar PV power plant - ScienceDirect – S. Das, 2021
- Ard Solar Power Forecasting Method Final Results (internal document, 2025)
Share Insights:


